

Michigan Literacy Bright Spots
 MAISA, in partnership with MASA and MDE, is launching a Michigan Bright Spots in Literacy initiative that builds upon the foundational work of the Reading Now Network (RNN) and expands its learning statewide.

This data tool has now progressed through four iterations, resulting in RNN 4.1. Like previous versions, the RNN compares academic achievement among similar schools by accounting for important student and school characteristics ("At-Risk Factors"), including Economic Disadvantage, Locale (Urban, Suburban, Rural), Chronic Absenteeism, and the percentage of students with disabilities who take the standard assessment.
RNN 4.1 expands the analysis to include grades 3–11 by combining M-STEP, PSAT, and SAT results for the first time in the history of the project, and with great appreciation to the Michigan Department of Education (MDE) and the Michigan Association of Superintendents and Administrators (MASA).

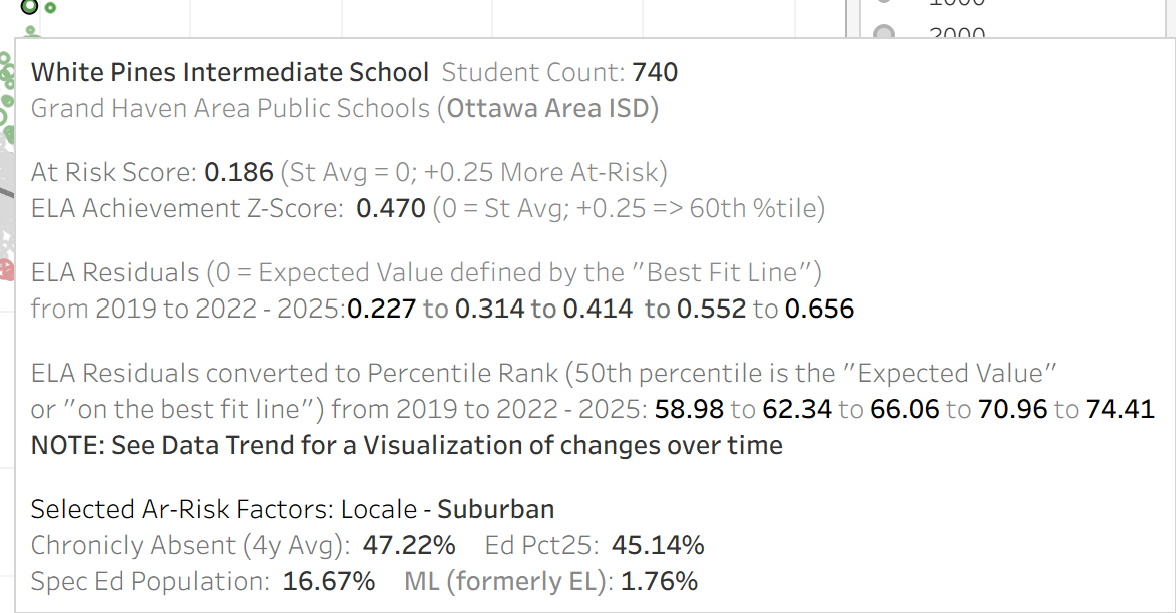 As the mouse hovers over the educational entities (schools, districts, ISDs), a pop-up window will occur. For example, White Pines Intermediate School, happens to be a circle in green towards the middle of the Scatter Plot because the "At-Risk" factors are close to the State Averages of: FRL near 41%, Chronic Absenteeism near 27% (four year average), and an estimated number of Special Ed students taking the standard state test near 8%. (state average closer to 14%).
Pop-up Information for each entity shows demographic data, achievement data (Z-score) and over the years, each "Residual," the amount above/below the expected achievement line and "Percentile Rank" converted from the residual.
The "pop-up" also includes trend data for "how much above or below the expected value in terms of standard deviations" a.k.a the residual. For this example, 0.227 (59th %tile) --> 0.314 (62%tile) --> 0.414 (66%tile) --> 0.552 (71%tile) --> 0.656 (74th %tile) implying that the school made academic gains from 2019 --> 2022 --> 2025 compared to similar schools across the state.
New Trend Data
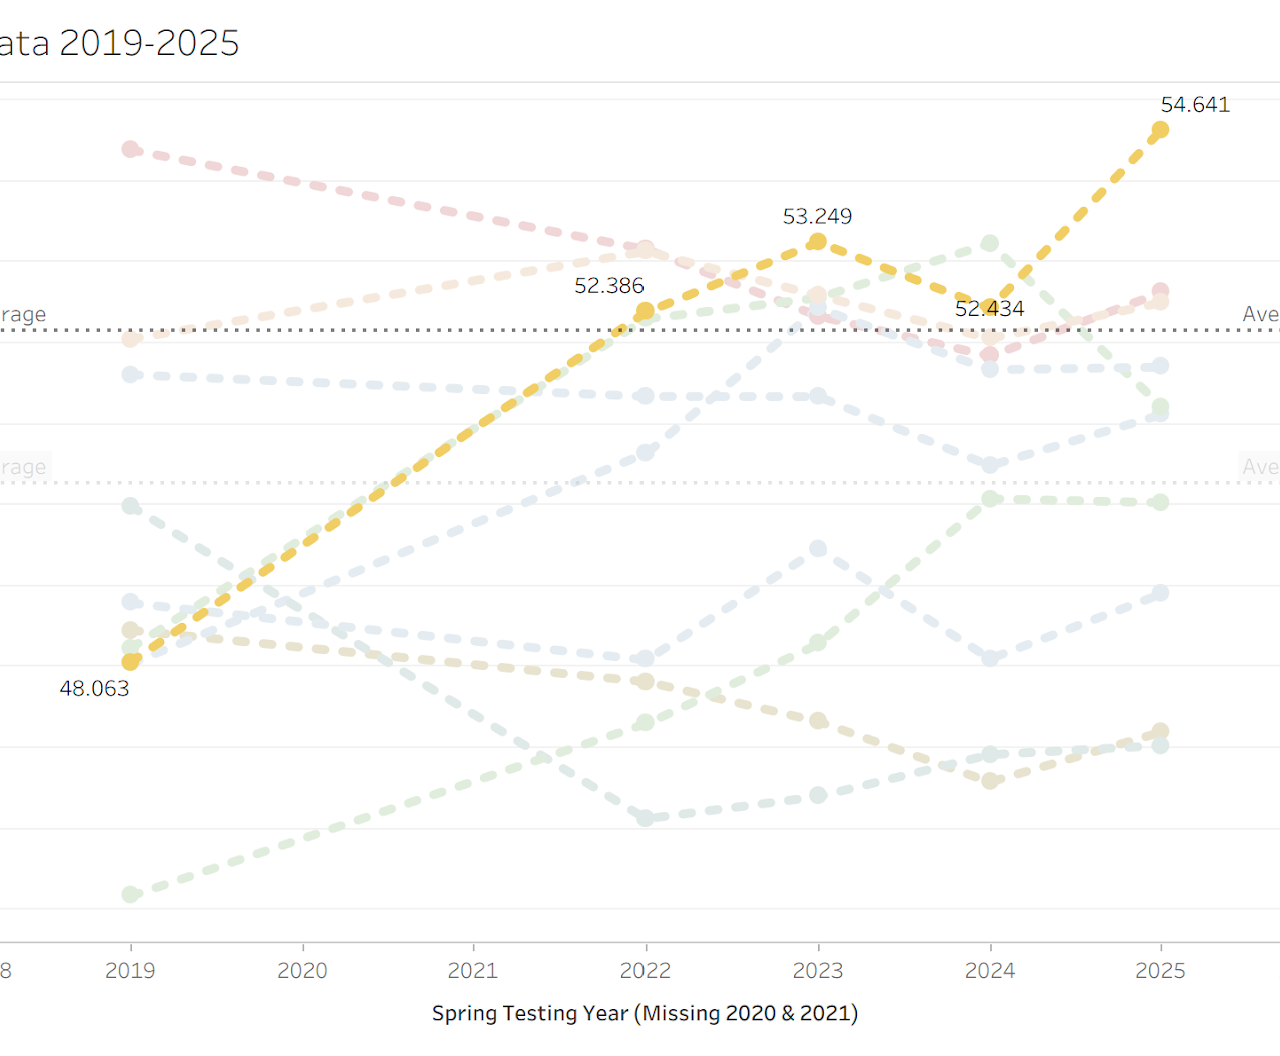 The third tab on the Tableau is a Data Trend where a trend line for the Residual or Percentile Rank primarily (Z-score and At-Risk can also be filtered). A residual of 0.500, or 1/2 of standard deviation, corresponding to 19 Percentile points above the expected value (50th Percentile) or the 69th Percentile. In the example pictured, the "Detail - Percentile" will populate when you hover over a school building or when you use the "highlighter" on the right to highlight an entity.
The videos above and below have further guidance on the data trend and there are data definitions below.
Additional Support
Scatterplots
Trendlines
in partnership with Dr. Doug Greer